


Next: A simulated AGILE observation
Up: Observing the Diffuse Emission
Previous: Model vs Observations
Contents
The study of Galactic diffuse gamma emission will be one of the main scientific
objectives of AGILE,
the ASI satellite for gamma-ray astronomy that will be launched in 2005 [Tavani et al., 2003].
The AGILE solid-state tracker (the GRID instrument) will have a field of view considerably larger than that of previous gamma imagers.
It will be able to cover  sr with one single pointing with an on-axis effective area about one half of that of EGRET and considerably better above
 off axis.
This means that AGILE will collect, for the same observing time, a number of diffuse photons larger by a factor of two.
off axis.
This means that AGILE will collect, for the same observing time, a number of diffuse photons larger by a factor of two.
AGILE will also be the gamma-ray imager with the best angular resolution
obtained to date, about a factor two better than EGRET for photons with energy larger than 400 MeV,
with a point spread function depending weakly on off-axis angle.
In order to better exploit these capabilities, a very accurate model of the interstellar gamma-ray
emission is required for the analysis of AGILE data.
In figures 3.5-3.5 is shown the model described in the previous chapter convolved whit the agile Point Spread Function for different energies.
These maps show only the contribution of galactic diffuse emission, but in the real observations the gamma ray point sources will be superposed to these structures.
Due to the energy dependence of the Point Spread Function the map structures result to be more resolved at high energy,
at low energy instead the good resolution of the model is compromised and therefore the difference with the EGRET model becomes less visible. Nonetheless, the two models give different performance also for low energy in term of source analysis.
Figure 3.19:
The model convolved with the AGILE PSF for 100 MeV.
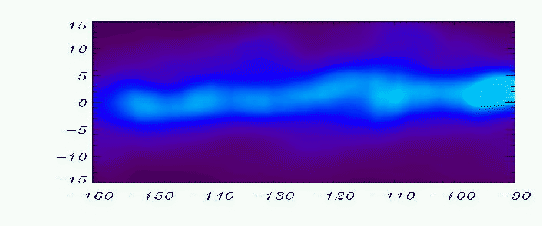 |
Figure 3.20:
The model convolved with the AGILE PSF for 400 MeV.
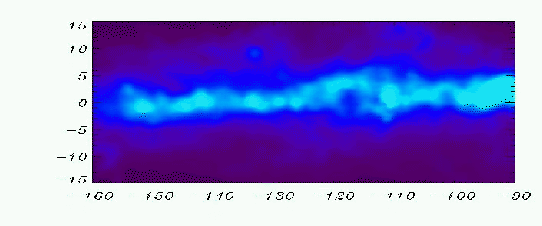 |
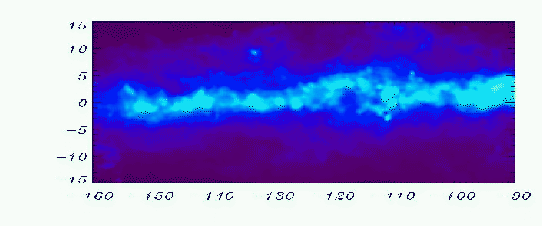
Figure 3.21:
The model convolved with the AGILE PSF for 1 GeV.
 |
Next: A simulated AGILE observation
Up: Observing the Diffuse Emission
Previous: Model vs Observations
Contents
Andrea Giuliani
2005-01-21