


Next: AGILE and the Diffuse
Up: Observing the Diffuse Emission
Previous: New vs old model
Contents
The gamma ray data presented in this section are a sum of the EGRET observations cycles from 1 to 9, which covers almost the whole observing life of the instrument.
The EGRET data for the outer Galaxy are represented in figures 3.15 and 3.16.
Figure 3.15 shows the intensity of gamma ray sky observed by EGRET as function of galactic latitude, averaged in longitude from 90 to 160 degrees (second galactic quadrant).
The thickness of the line represents the statistical uncertainty (1  ).
The red and the blue lines correspond to the AGILE and EGRET model respectively, convolved with the EGRET Point Spread Function.
The contribution of molecular and neutral hydrogen to gamma emission are represented by the green and yellow lines.
A constant value of
).
The red and the blue lines correspond to the AGILE and EGRET model respectively, convolved with the EGRET Point Spread Function.
The contribution of molecular and neutral hydrogen to gamma emission are represented by the green and yellow lines.
A constant value of 


 has been added to both the AGILE and EGRET model in order to take into account the extragalactic diffuse emission.
Figure 3.16 is the analogous plot but averaged over latitude.
has been added to both the AGILE and EGRET model in order to take into account the extragalactic diffuse emission.
Figure 3.16 is the analogous plot but averaged over latitude.
The figures 3.17 and 3.18 show, instead, the results for the inner Galaxy.
In this case, besides the contribution of neutral and molecular Hydrogen, the contribution of inverse Compton on interstellar radiation field is visible. From these plots a good agreement among the two models and EGRET observations can be found.
Figure 3.15:
Diffuse emission intensity observed by EGRET (E  100 MeV) as function of galactic latitude averaged in longitude from 90 to 160 degrees. The red and the blue lines represent the AGILE and EGRET model respectively. The figure shows also the contributes due to HI region (yellow), molecular clouds (green) and inverse Compton (sky-blue).
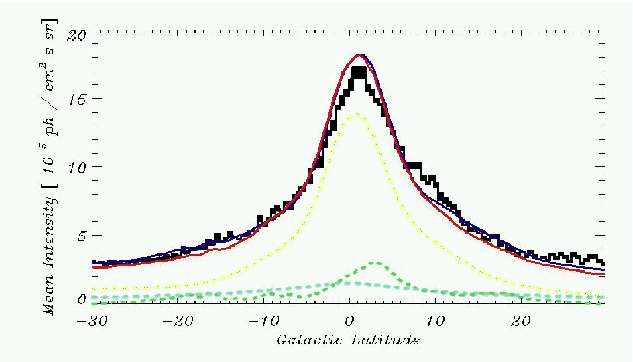 |
Figure 3.16:
As figure 3.15 but averaged over latitudes -30 to 30.
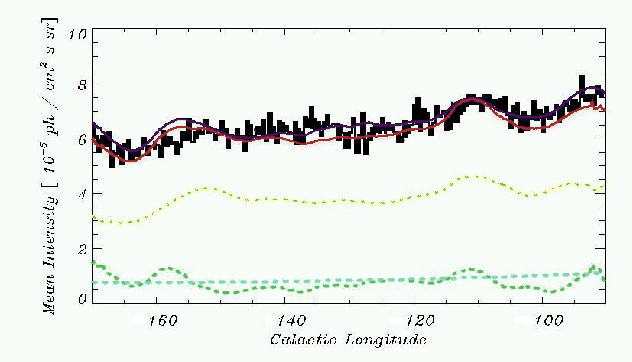 |
Figure 3.17:
Diffuse emission intensity observed by EGRET (E 100 MeV) as function of galactic latitude averaged in longitude from 0 to 90 degrees. The red and the blue lines represent the AGILE and EGRET model respectively. The figure shows also the contributes due to HI region (yellow), molecular clouds (green) and inverse Compton (sky-blue).
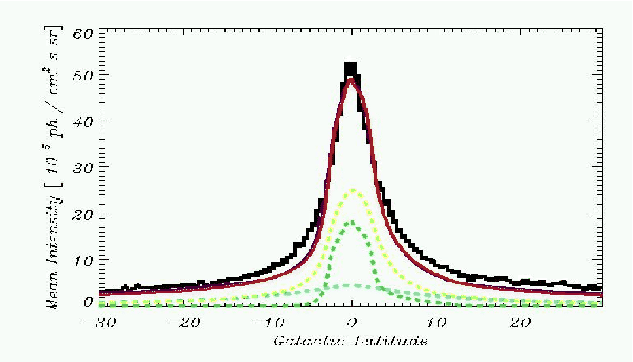 |
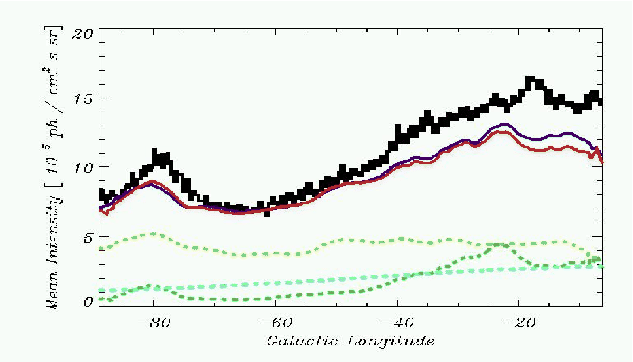
Figure 3.18:
As figure 3.17 but averaged over latitude -30 to 30.
 |
Next: AGILE and the Diffuse
Up: Observing the Diffuse Emission
Previous: New vs old model
Contents
Andrea Giuliani
2005-01-21