


Next: Model vs Observations
Up: Observing the Diffuse Emission
Previous: The gamma-ray sky
Contents
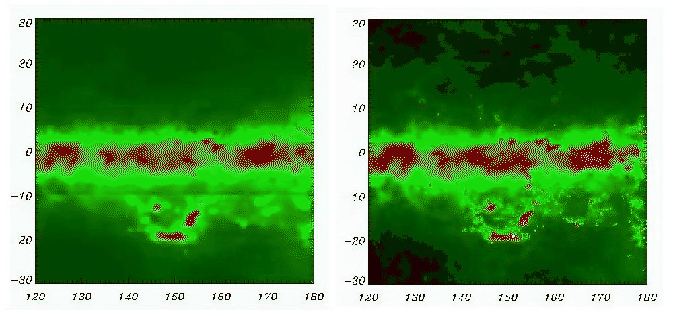
Figure 3.9 shows the comparison between the EGRET and AGILE diffuse emission models for the Polaris Flare regions, while the same comparison for the sky region dominated by the molecular cloud of Orion is given in figure 3.10.
Figure 3.10:
Comparison between the EGRET (left) and AGILE (right) diffuse emission model for the Orion molecular clouds regions.
The colorscale is the same shown by the colorbar of figure 3.1.
 |
Obviously the finer grid with which the AGILE model is built (bin area is
 degrees) gives a better resolution to the gamma sky map.
Figures 3.11 - 3.14 show the galactic latitude and longitude gradients for the two models.
They indicate a good agreement between the two models on the galactic plane and a discrepancy outside the plane that can be understood in terms of the different height dependence of the cosmic-ray electronic component.
degrees) gives a better resolution to the gamma sky map.
Figures 3.11 - 3.14 show the galactic latitude and longitude gradients for the two models.
They indicate a good agreement between the two models on the galactic plane and a discrepancy outside the plane that can be understood in terms of the different height dependence of the cosmic-ray electronic component.
Figure 3.11:
Galactic latitude profiles for the EGRET (black) and AGILE (red) model for energy channel 100 MeV - 150 MeV and different ranges of longitude.
 |
Figure 3.12:
Galactic longitude profiles for the EGRET(black) and AGILE (red) model for energy channel 100 MeV - 150 MeV and different ranges of latitude.
 |
Figure 3.13:
Galactic latitude profiles for the EGRET(black) and AGILE (red) model for energy channel 1 GeV - 3 GeV and different ranges of longitude.
 |
Figure 3.14:
Galactic longitude profiles for the EGRET (black) and AGILE (red) model for energy channel 1 GeV - 3 GeV and different ranges of latitude.
 |
Next: Model vs Observations
Up: Observing the Diffuse Emission
Previous: The gamma-ray sky
Contents
Andrea Giuliani
2005-01-21