


Next: Interstellar Radiation Field
Up: Modeling the Gamma-Ray Emission
Previous: Rotation curve
Contents
Diffuse matter distribution
For the HI Hydrogen distribution we used the Leiden-Dwingeloo 21 cm survey
([Hartmann & Burton, 1997]).
This survey covers the sky above declination -30 .
The Leiden-Dwingeloo survey improves the previous results especially in terms of sensitivity (an order of magnitude better), velocity range and resolution.
For the region around the south celestial pole, which is not covered by this survey,
we used other observations, such as those from the Maryland-Parkes survey
([Kerr et al., 1986]).
.
The Leiden-Dwingeloo survey improves the previous results especially in terms of sensitivity (an order of magnitude better), velocity range and resolution.
For the region around the south celestial pole, which is not covered by this survey,
we used other observations, such as those from the Maryland-Parkes survey
([Kerr et al., 1986]).
The neutral Hydrogen density along the line of sight can be obtained by:
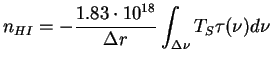 |
(2.9) |
where  is the spin temperature and
  is the optical thickness:
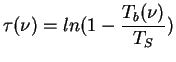 |
(2.10) |
where  is the observed brightness temperature.
The molecule of Hydrogen does not emit vibrational or rotational excitation mode.
Therefore, in order to map the molecular Hydrogen distribution, it is used to observe the radiation emitted by CO as many observations have shown a strong correlation between CO emission,  , and
, and  density,
  .
The CO is assumed to be a tracer of molecular hydrogen with a ratio between hydrogen density and CO radio emissivity given by the factor X:
.
The CO is assumed to be a tracer of molecular hydrogen with a ratio between hydrogen density and CO radio emissivity given by the factor X:
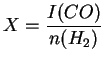 |
(2.11) |
The deprojected column density of molecular Hydrogen is related to the CO brightness temperature by the relation:
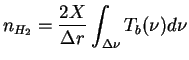 |
(2.12) |
In order to obtain the distribution of molecular hydrogen we use the CO observations described in [Dame et al., 2001].
These observations came from 31 surveys which cover different portions of the galactic plane.
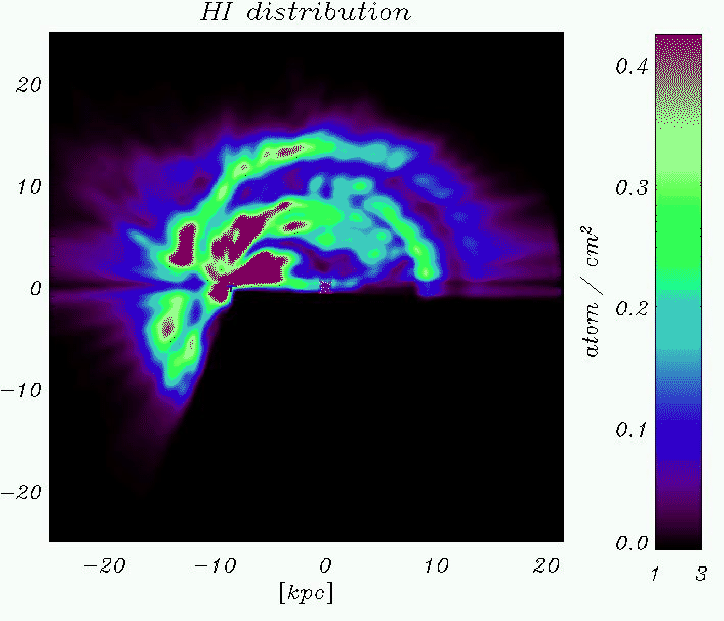
Figure 2.6:
Atomic Hydrogen density on the Galactic Plane [Giuliani et al., 2003a],
derived from the Leiden-Dwingeloo survey. The south celestial pole is not covered by this survey.
 |
Next: Interstellar Radiation Field
Up: Modeling the Gamma-Ray Emission
Previous: Rotation curve
Contents
Andrea Giuliani
2005-01-21