Next: About this document ...
SGAMATI GROUP
The ASTRI ``Visibility Tool'' (Sensitivity_calculator.py) is a Python script able to simulate the spectrum of a source, given an .xml file with the spectral shape, the exposure time and the significance of the simulated flux data points at different energies.
However, the script needs that some environment variables are set before launching it. First of all, the user has to download and install the CTOOLS and gammalib softwares (http://cta.irap.omp.eu/ctools/download.html). Then the user has to check that the following steps have been done:
 /home/ASTRI_test) and put the file ASTRI Visibility tool (Sensitivity_calculator.py) and the python module ``atspec_dev.py'' into this folder;
The user can launch the script by typing in the terminal:
/home/ASTRI_test
The script will ask the user:
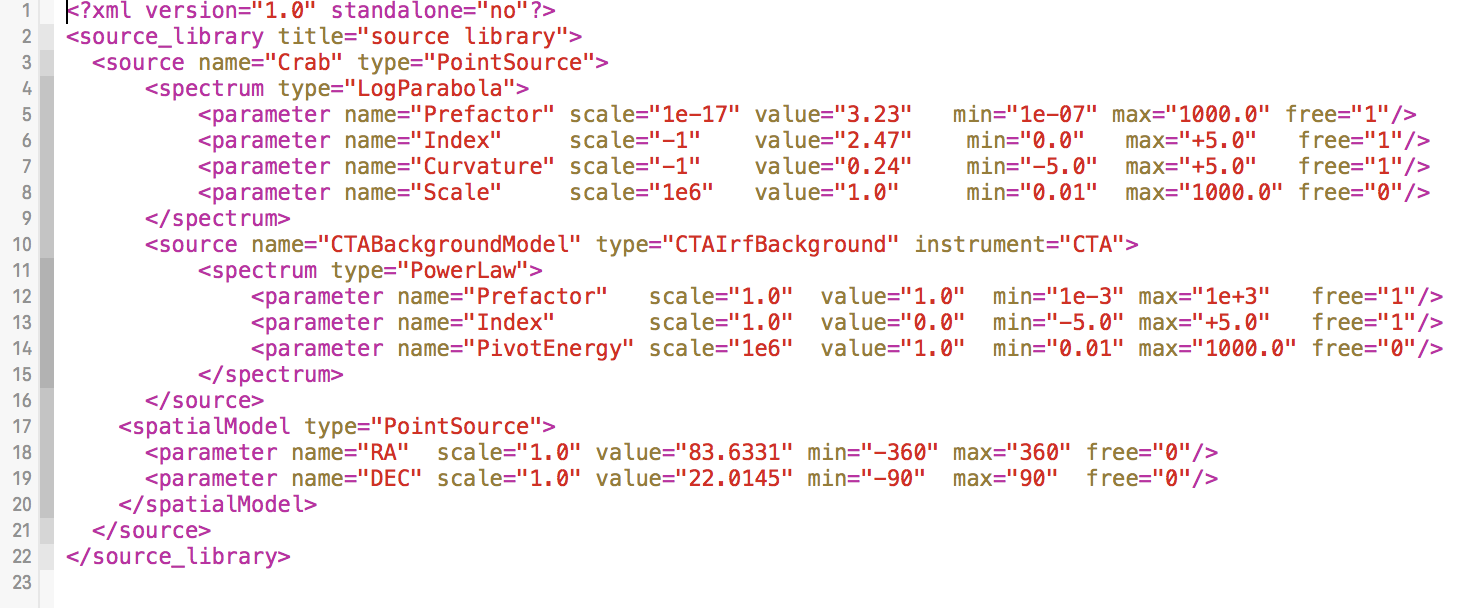
The format of the .xml needs the source to be simulated as first element; if the .xml will have more than one source, the script will simulate only the first one anyway. Furthermore, the script is also able to simulate the background but the only one provided by the IRF file. In the following (Figure 1), an example of a readable .xml file:
 |
If the file is correctly given, the script will print on screen the source coordinates, the spectrum model and the exposure time (remember that ctobssim will reduce the exposure time of  ) and the source Galactic coordinates as in Figure 2.
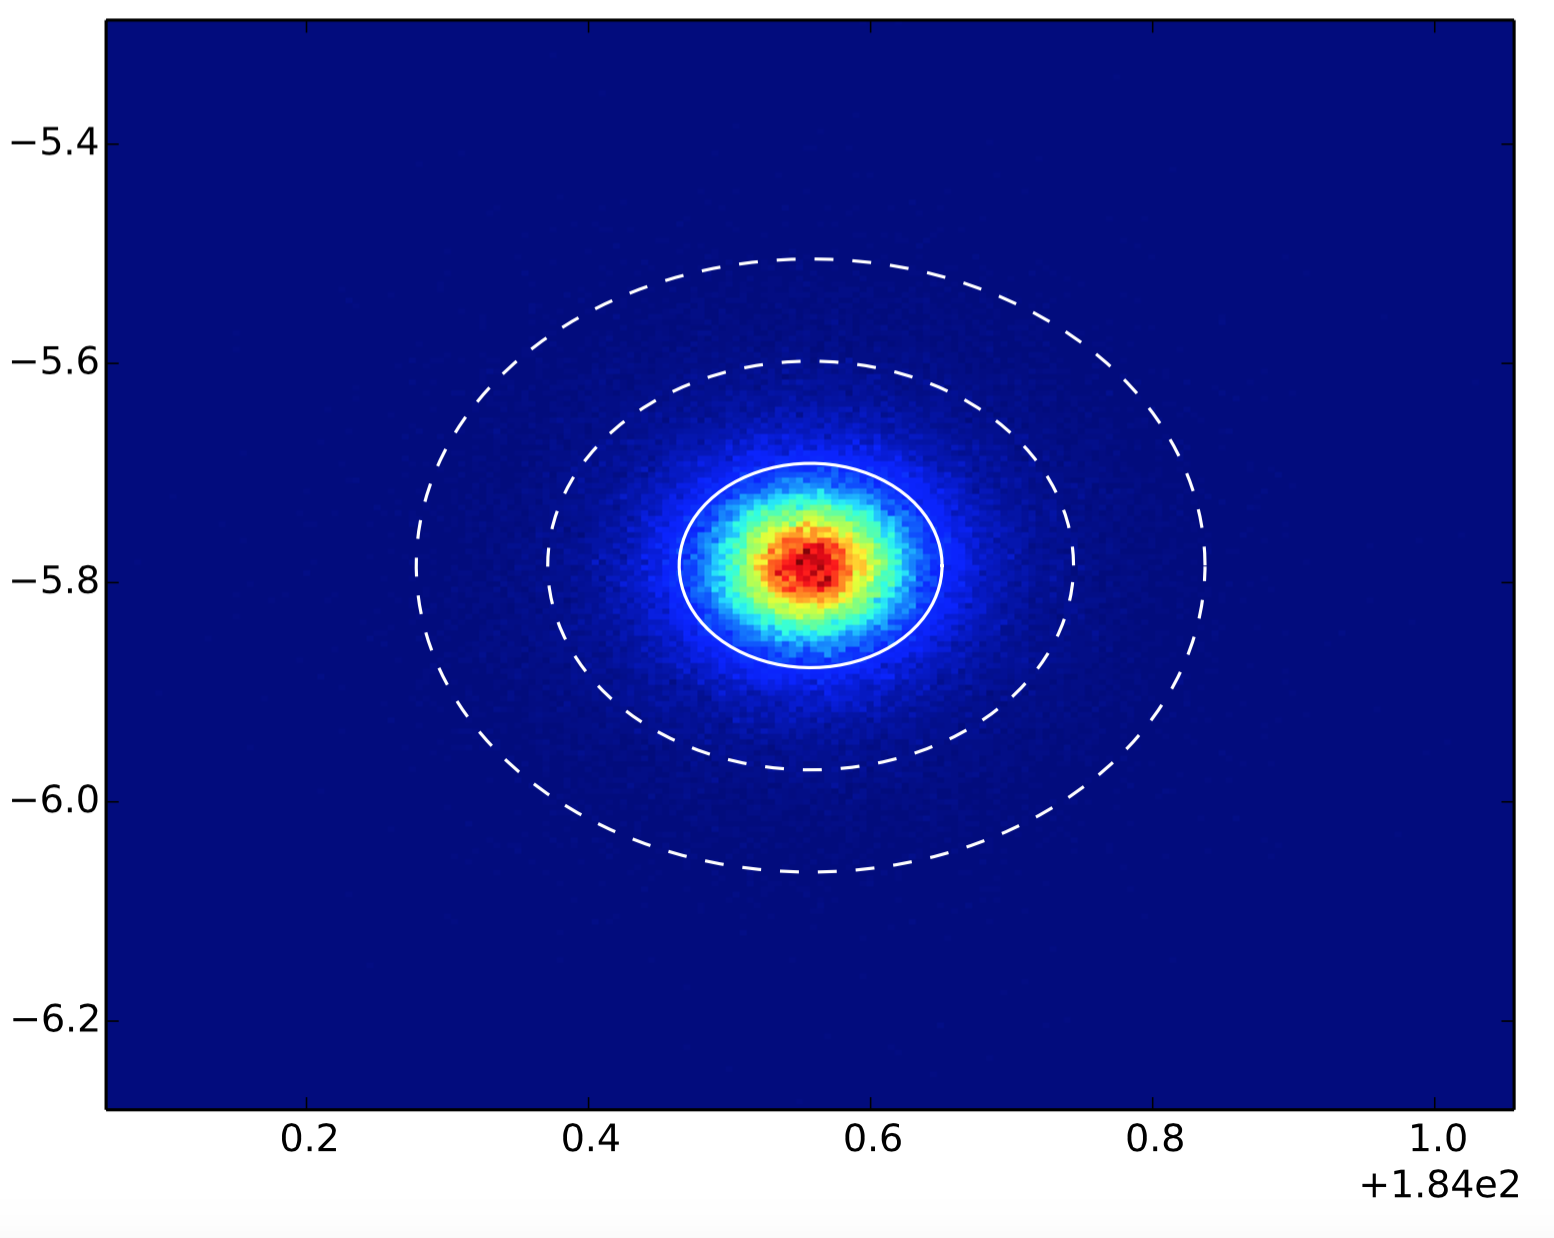
It will also show the skymap of the simulated data, as in the example of Figure 4, where the regions chosen for the source and background are showed. To continue, the user has to close the output skymap.
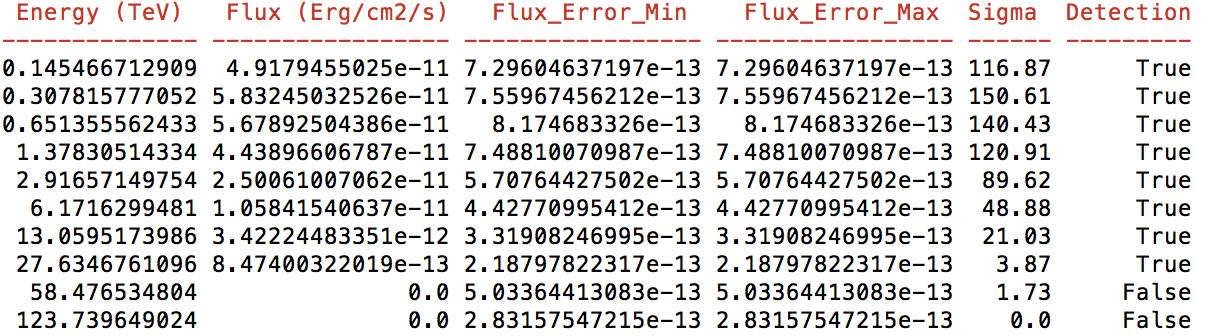
After that, the script will evaluate the simulated spectrum, printing on the screen, for each energy bin, the flux, its error (lower and upper) and the significance of the points (example in Figure 4). The output will be also printed into a .fits file.
The script will finish saving an image (in .png) of the simulated spectrum (also with the simulated spectral model).